Take three or four exposures of the same scene. Don’t change anything on the camera and keep the framing the same.
This histogram is a graphical representation of the colour and luminosity within the image. The left side of the graph represents the shadows, the right side is the highlights, with the mid tones being identified in the centre.
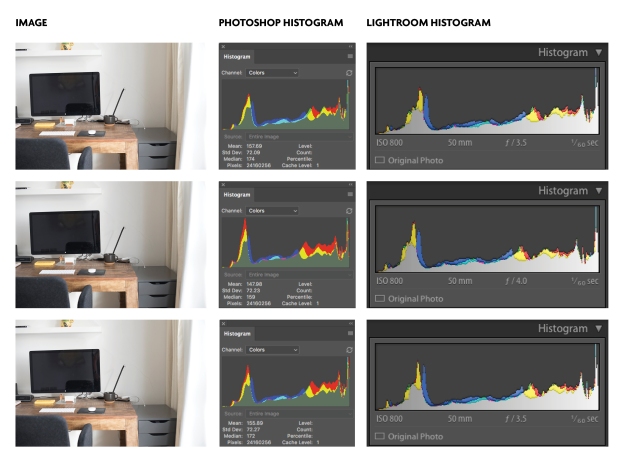
I shot the above three images in quick succession, with the camera set to automatic mode, and, mounted on a tripod. At first glance, the images appear to be very similar, as do the histograms. This image does not utilise a large range of colours and the contrast is fairly substantial, therefore the histogram is reflecting all this by showing the spike that indicates the shadows on the left, with a fairly flat representation in the middle, rising up to reflect the highlights, on the right.
There is no clipping on the left-hand side of the histogram, the spike naturally comes down to the x-axis suggesting that the shadows on all channels (red, green and blue) are all correct. The histogram also shows that there is colour right up to the edge, which means there is a full black somewhere within the shot. However, looking at the highlights end of the histogram, there are large spikes which have been clipped on the right hand edge, meaning that I have lost detail on all three channels. This image is therefore slightly overexposed.
The most obvious difference when comparing the three histograms is that of the height of the spike at the darker end. The spike on the first image is lower than the second and third images, and the second image has the highest spike. This suggests that the shadows are darkest in the second image and lightest in the first.
There is also an interesting anomaly happening within the blue channel, where the spike on the left-hand side is sitting out of kilter with the others. This suggests that the white balance of the image is slightly off.
References
Practical Photography Tips. 2017. Color Histograms. [ONLINE] Available at: http://practicalphotographytips.com/Digital-Camera-Basics/color-histograms.html. [Accessed 5 June 2017].
Digital Photography School. 2017. How to Read and Use Histograms. [ONLINE] Available at: https://digital-photography-school.com/how-to-read-and-use-histograms/. [Accessed 5 June 2017].
